Projects
Solar Feature Identification and Tracking
At a Glance
Objective
Identify and track photospheric features such as sunspots and faculae.Approach
Bayesian: Markov Random Field prior plus Gaussian Mixture Model classifier to identify objects in individual images. Atop this, developed object tracker for photospheric features (thousands of objects across thousands of images).Accomplishment
Used most recently for HMI (Helioseismic and Magnetic Imager) on SDO (Solar Dynamics Observatory). Masks and tracked objects are a standard HMI data product ("HARP", for HMI Active Region Patch) and a building block for derived products for space weather forecasting ("SHARP"). A companion data product ("MHARP") is also available for MDI (Michelson Doppler Imager) on SOHO.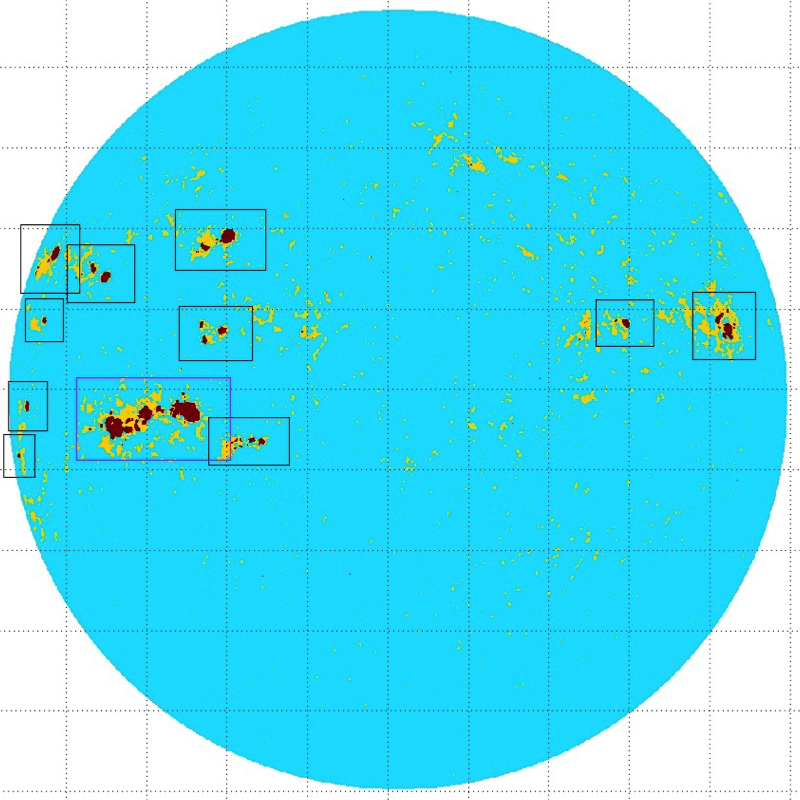
Further Information
We have developed original methods for identifying active regions and other features in multimodal solar imagery. The resulting sunspots may be tracked through multiple images over their lifetime. Below is a result from the large-scale application of the combined identification and tracking algorithm. The center panels show 47 views of a tracked sunspot, approximately four per day, over two weeks' time. Learned sunspot maps are shown in upper frames, magnetograms below. The sunspot was found and tracked automatically, and corresponds to NOAA region 10095. Two full-disk snapshots are also shown in the left and right columns to indicate the substantial complexity of the other objects present, which are also being tracked. Each sunspot found in these snapshots also corresponds to a NOAA region found on that day; however, the NOAA regions are identified and tracked manually. We analyzed eight years of MDI data in this way, finding 2500 sunspots in hundreds of thousands of images and reducing data volume 100 times.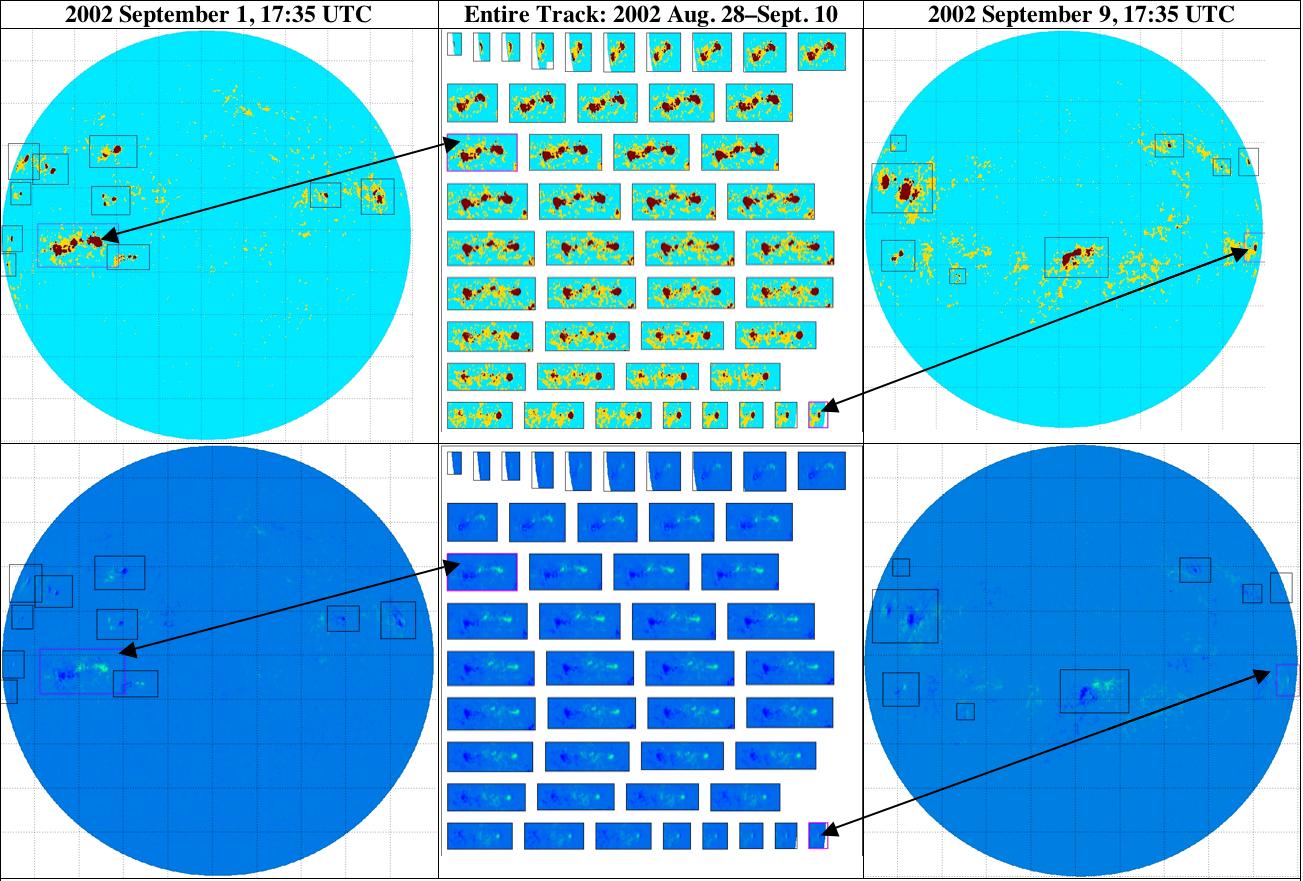
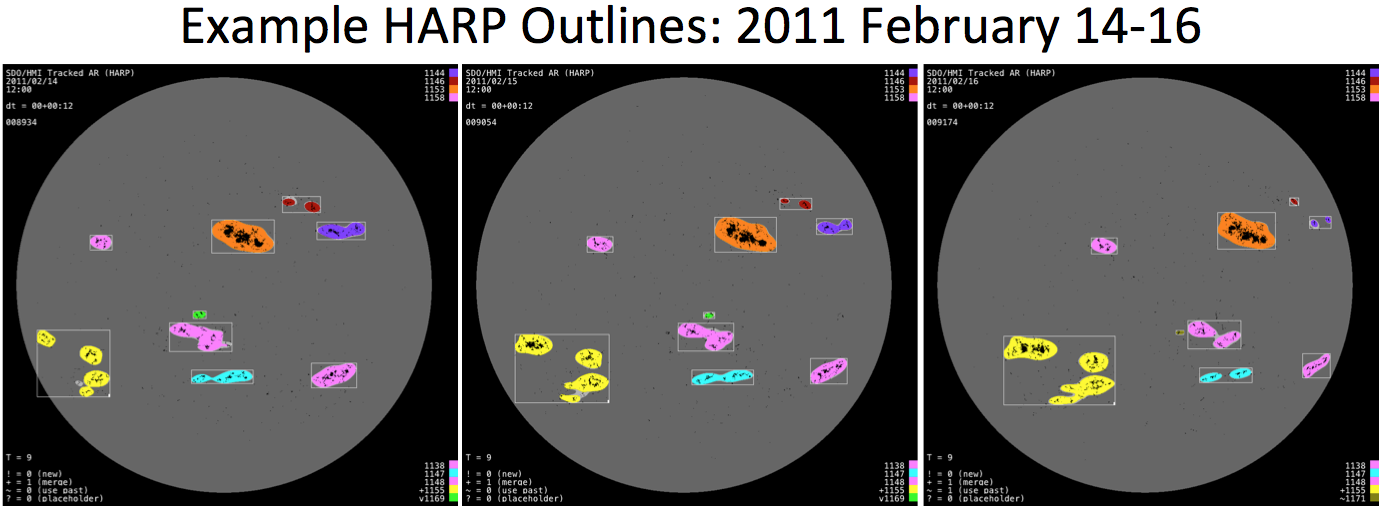
The figure below shows a similar result from HMI aboard SDO.
We show HARP outlines for three days: 2001 February 14, 15, and 16, 00:00 TAI,
solar South on top,
selected from the 12-minute cadence original data product.
HARPs are shown in the same color (some colors repeated) with a thin white
contextual box surrounding each HARP.
HARPs are assigned an ID number, tracked, and associated from image to image.
HARPs, such as the yellow one in the images above, need not be connected
regions.
Merges and splits, such as the light blue region, are accounted for automatically.
Selected Publications
Hoeksema, J. T., Liu, Y., Hayashi, K., Sun, X., Schou, J. and others (2014). “The HMI vector magnetic field pipeline: Overview and performance,” Solar Physics, 289, pp. 3483-3530, Springer. Document (link to DOI).
Turmon, M., Hoeksema, J. T., and Bobra, M. (2014). “Tracked Active Region Patches for MDI and HMI,” American Astronomical Society Meeting Abstracts #224, vol. 224, pp. #123.52. Document.
M. Turmon, H. P. Jones, O. Malanushenko, and J. Pap (2010). “Statistical feature recognition for multidimensional solar imagery,” Solar Physics, 262(2), pp. 277–298. Document (CL 10-0771).
J. Pap, I. Ermolli, F. Gyorgi, and M. Turmon (2004). “Study of Solar Magnetic Feature Properties and Irradiance Variations,” 35th COSPAR Scientific Assembly, vol. 35. Document.
M. Turmon (2004). “Symmetric Normal Mixtures,” Compstat 2004-Proceedings in Computational Statistics, pp. 1909-16, Physica-Verlag. Document (CL 04-1276).
J. Pap, H. Jones, M. Turmon, and L. Floyd (2002). “Study of the SOHO/VIRGO Irradiance Variations Using MDI and Kitt Peak Images,” Proc. SOHO-11 Workshop. ESA SP-508.
M. Turmon, J. Pap, and S. Mukhtar (2002). “Statistical Pattern Recognition for Labeling Solar Active Regions: Application to SoHO/MDI Imagery,” Astrophysical Journal, 568(1), pp. 396-407. Document (CL 01-2847).
M. Turmon (2001). “Mixture models for labeling scientific imagery,” Mixtures 2001: Recent Developments in Mixture Modeling, Hamburg. Presentation (refereed).
M. Turmon, J. M. Pap, and S. Mukhtar (1998). “Automatically finding solar active regions using SoHO/MDI photograms and magnetograms,” Proc. SoHO 6/GONG '98 Workshop on Structure and Dynamics of the Sun, vol. 418, pp. 979-984. Document.
M. Turmon (1997). “Identification of Solar Features via Markov Random Fields,” Proc. Second Conf. International Assoc. for Statistical Computing (IASC-2), pp. 194–200. Document.
M. Turmon and J. Pap (1997). “Segmenting Chromospheric Images with Markov Random Fields,” Statistical Challenges in Modern Astronomy II, ed. G. Babu and E. Feigelson, pp. 408–411, Springer. Document.
M. Turmon, S. Mukhtar, and J. Pap (1997). “Bayesian Inference for Identifying Solar Active Regions,” Proc. Third Conf. on Knowledge Discovery and Data Mining, ed. D. Heckerman, H. Mannila, D. Pregibon, and R. Uthurusamy, pp. 267-270, MIT Press. Document (CL 97-0755).
M. Turmon and S. Mukhtar (1997). “Recognizing Chromospheric Objects via Markov Chain Monte Carlo,” Proc. IEEE Intl. Conf. Image Processing, vol. 3, pp. 320–323. Document (CL 97-1147).